
NASA satellites map the human fingerprint on continental water; Brazilian Highlands among the largest losses
A study using more than 20 years of GRACE data identifies 40 regions where irrigation, reservoirs and land use changed stored water. In the Brazilian Highlands, losses reach 24.3 gigatonnes per year.
RockGeo Editorial · Published on
Event date: 10/20/2026 · Source date: 10/20/2026
Sources accessed on 10/25/2026, 13:37 GMT
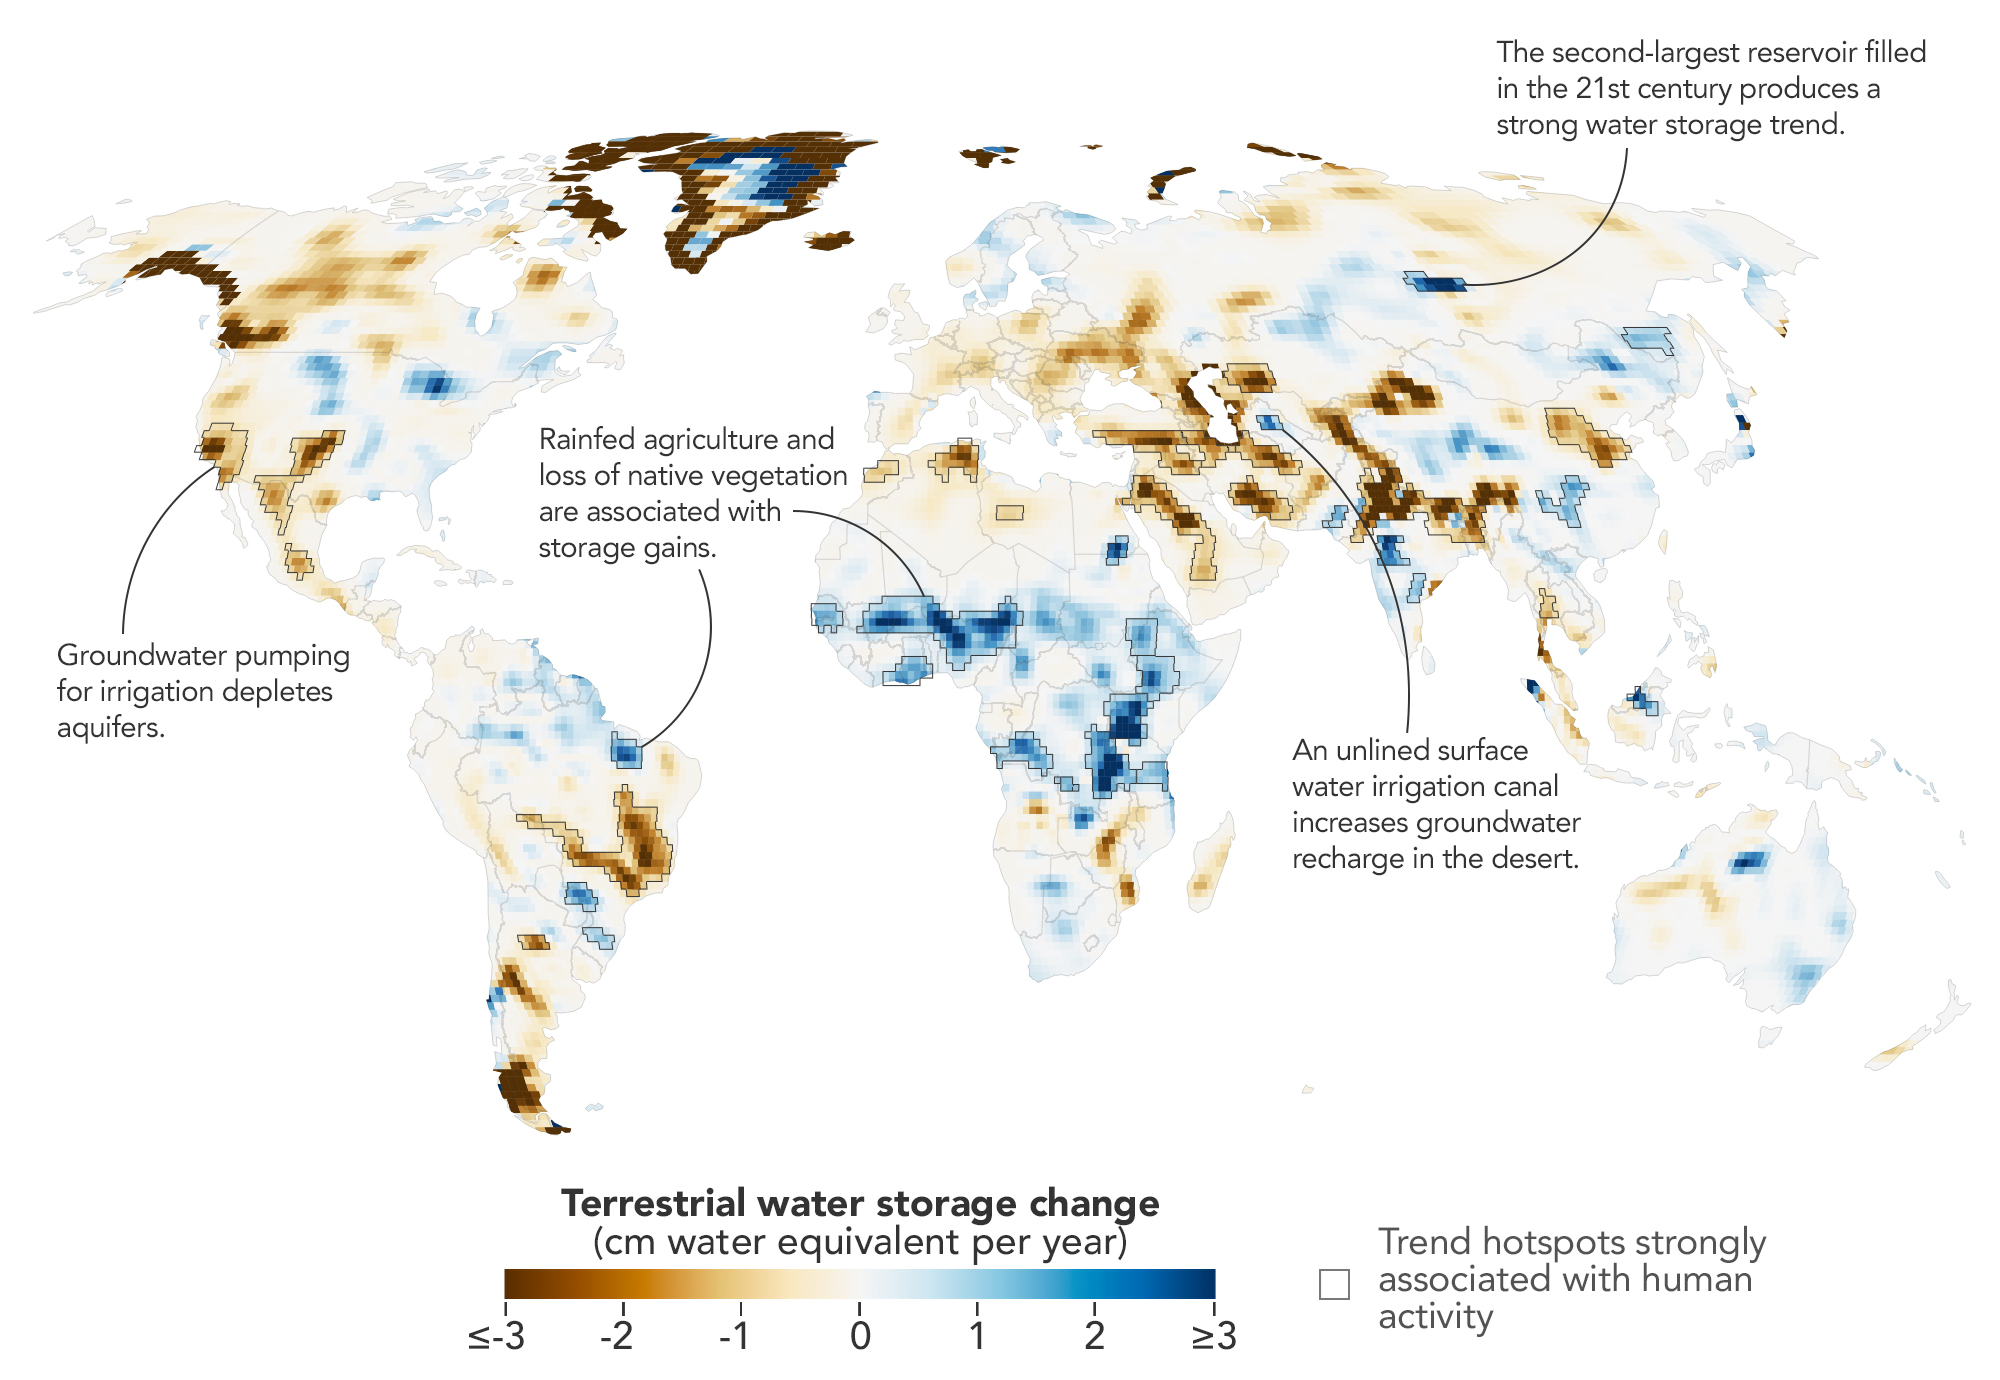
NASA Earth Observatory/Michala Garrison, based on data from O’Neill et al. (2026) · NASA Images and Media Usage Guidelines (not copyrighted in the U.S.)
NASA Earth Observatory published a global map on 20 October 2026 showing where human activity, not just climate, has changed how much water is stored on the continents. Based on more than two decades of satellite gravity measurements, the work identifies 40 regions where storage trends track irrigation, reservoir filling or land-use change. According to the agency, these factors were significantly related to the trends on every nonpolar continent except Australia.
The data come from the GRACE mission, launched in 2002, and GRACE-FO, launched in 2018. Each uses two satellites flying in tandem: as they pass over a region with more or less mass, the distance between them changes, revealing the weight of water held in rivers, soils and aquifers. The study, by Mary Michael O’Neill, Matthew Rodell and Bryant D. Loomis and published in PNAS on 14 September 2026, processed the raw data from April 2002 to November 2025 in a single solution. The technique trades month-to-month detail for spatial resolution: about 12,000 km² at mid-latitudes, compared with more than 120,000 km² for conventional methods.
The strongest result for Brazil is in the Brazilian Highlands, which lost 24.3 ± 2.5 gigatonnes of water per year, the second-largest decline among the 40 regions. One gigatonne is one billion tonnes, roughly one cubic kilometre of water. The authors link the loss to below-average rainfall during two strong El Niño events, in 2015–2017 and 2019–2020, combined with groundwater-fed irrigation and a rising atmospheric vapour pressure deficit, which increases the demand for water.
The map also records gains in the country. In Maranhão, storage grew by 3.7 ± 0.8 gigatonnes per year in a region where forest cover fell by 15%. The central Paraná basin and Brazil’s South Atlantic region also gained, by 2.4 and 1.0 gigatonnes per year. The proposed explanation is that rainfed crops such as legumes and cereals transpire less and draw on shallower water than native vegetation, letting more water infiltrate down to aquifers; the authors stress that rainfall and air humidity also shape these trends.
Outside Brazil, the largest loss was in northern India, at 32.4 ± 4.0 gigatonnes per year, tied to groundwater pumping; retreating Himalayan glaciers explain only 15% of the decline. California’s Central Valley, the U.S. High Plains and Chihuahua, Mexico, show the same pattern of well-irrigated farming during droughts. Together, the 40 regions lost 3,122 gigatonnes and gained 2,432 over the period, and regional trends were on average 33% larger than estimated with the traditional method.
“In four continental regions, an anthropogenic variable showed a stronger relationship with the storage trends than any climate variable did,” hydrologist Mary Michael O’Neill of NASA’s Goddard Space Flight Center, the study’s lead author, told NASA. According to the agency, she wants to track how dams, diversions and irrigation affect water downstream and to recover more detail over time, in order to follow responses to droughts or policy changes.
The method has clear limits. It measures long-term trends, not year-to-year swings, and its scale of about 100 km does not replace field monitoring of wells and aquifers. The attribution to human activities is statistical and combines the maps with published studies; the authors themselves note that rainfall and air humidity can overlap with these effects. The next mission, GRACE Continuity, is scheduled to launch in 2028 and should extend the record.