
Simon from space: terrain and atmospheric waves in Mexico
Images published by NASA on October 14 show Simon near Mexico’s coast on October 11. Satellites recorded the hurricane’s eye and waves in the upper atmosphere.
RockGeo Editorial · Published on
Event date: 10/11/2026 · Source date: 10/14/2026
Sources accessed on 10/14/2026, 15:22 GMT
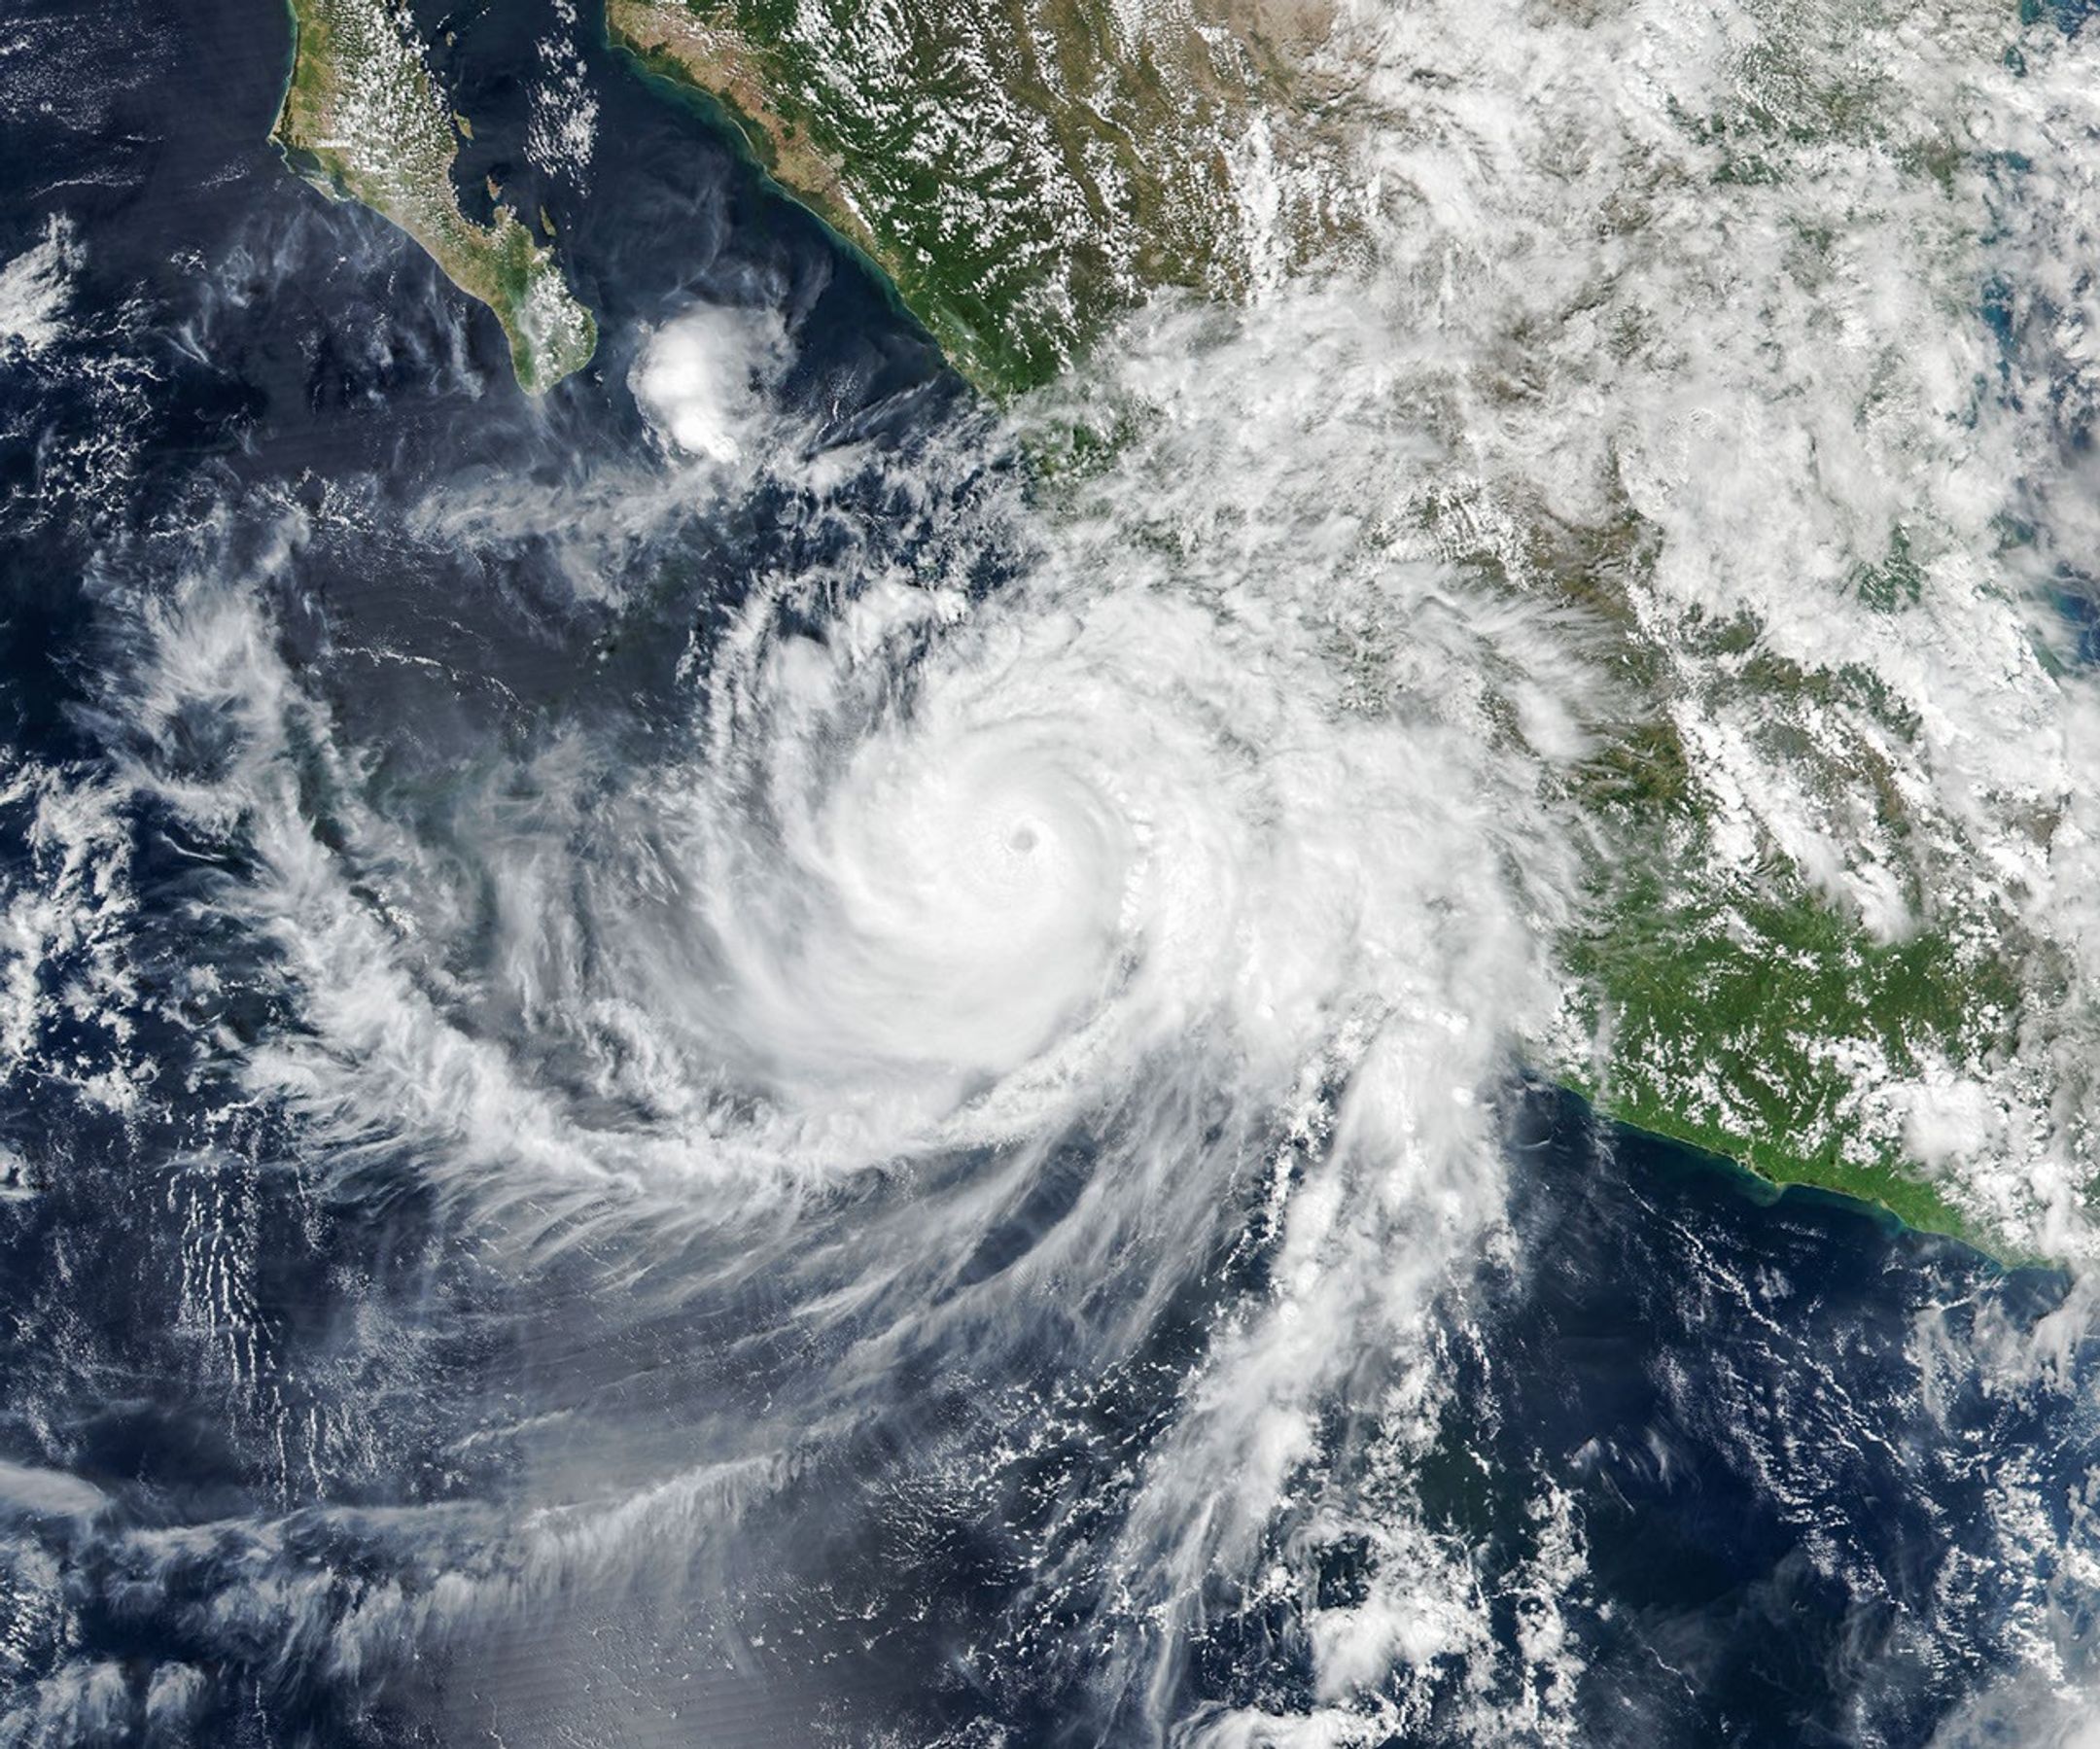
NASA Earth Observatory / Michala Garrison; VIIRS data: NASA/NOAA · NASA factual editorial use permitted under Media Usage Guidelines
NASA published images of Simon on October 14, 2026, acquired on October 11 near Mexico’s Pacific coast. Lindsey Doermann’s report combines observations from two satellites. The daytime Suomi NPP image shows the eye over the ocean and cloud bands reaching land; the nighttime NOAA-21 observation reveals atmospheric waves.
In Discussion 18, issued at 21:00 GMT on October 11, the National Hurricane Center classified Simon as Category 4 with sustained winds of 115 knots. The bulletin linked declining intensity and a shrinking wind field to the nearby high terrain of the Sierra Madre as the inner core brushed the coast.
NHC used geostationary satellite imagery to track the eye and cloud-top temperatures. A synthetic aperture radar pass from RCM-1 helped adjust the 34-, 50- and 64-knot wind radii. These measurements and estimates belong to that historical bulletin, rather than describing current conditions.
Airglow is a faint emission of light by gases in the upper atmosphere. According to NASA Goddard, it provides information about temperature, density, composition and motion in that region. It is not the same phenomenon as an aurora, although both produce light above the surface.
In Simon’s nighttime observation, the ripples were associated with atmospheric gravity waves generated by cyclone convection. They can propagate into the stratosphere and mesosphere. VIIRS’s day-night band detects airglow, but upper-level winds and moonlight can make observation more difficult.
The images document connections between atmosphere, ocean and terrain without measuring the extent of floods or landslides by themselves. The daytime image dates to approximately 20:30 GMT on October 11. The release date, October 14, should not be confused with data acquisition or a current weather forecast.