
Kīlauea: radar and earthquakes track magma intrusions
A USGS analysis published on 23 October revisits recent intrusions. Maps from 2024 show how satellite data and seismicity complement one another.
RockGeo Editorial · Published on
Event date: 10/23/2026 · Source date: 10/23/2026
Sources accessed on 10/24/2026, 20:02 GMT
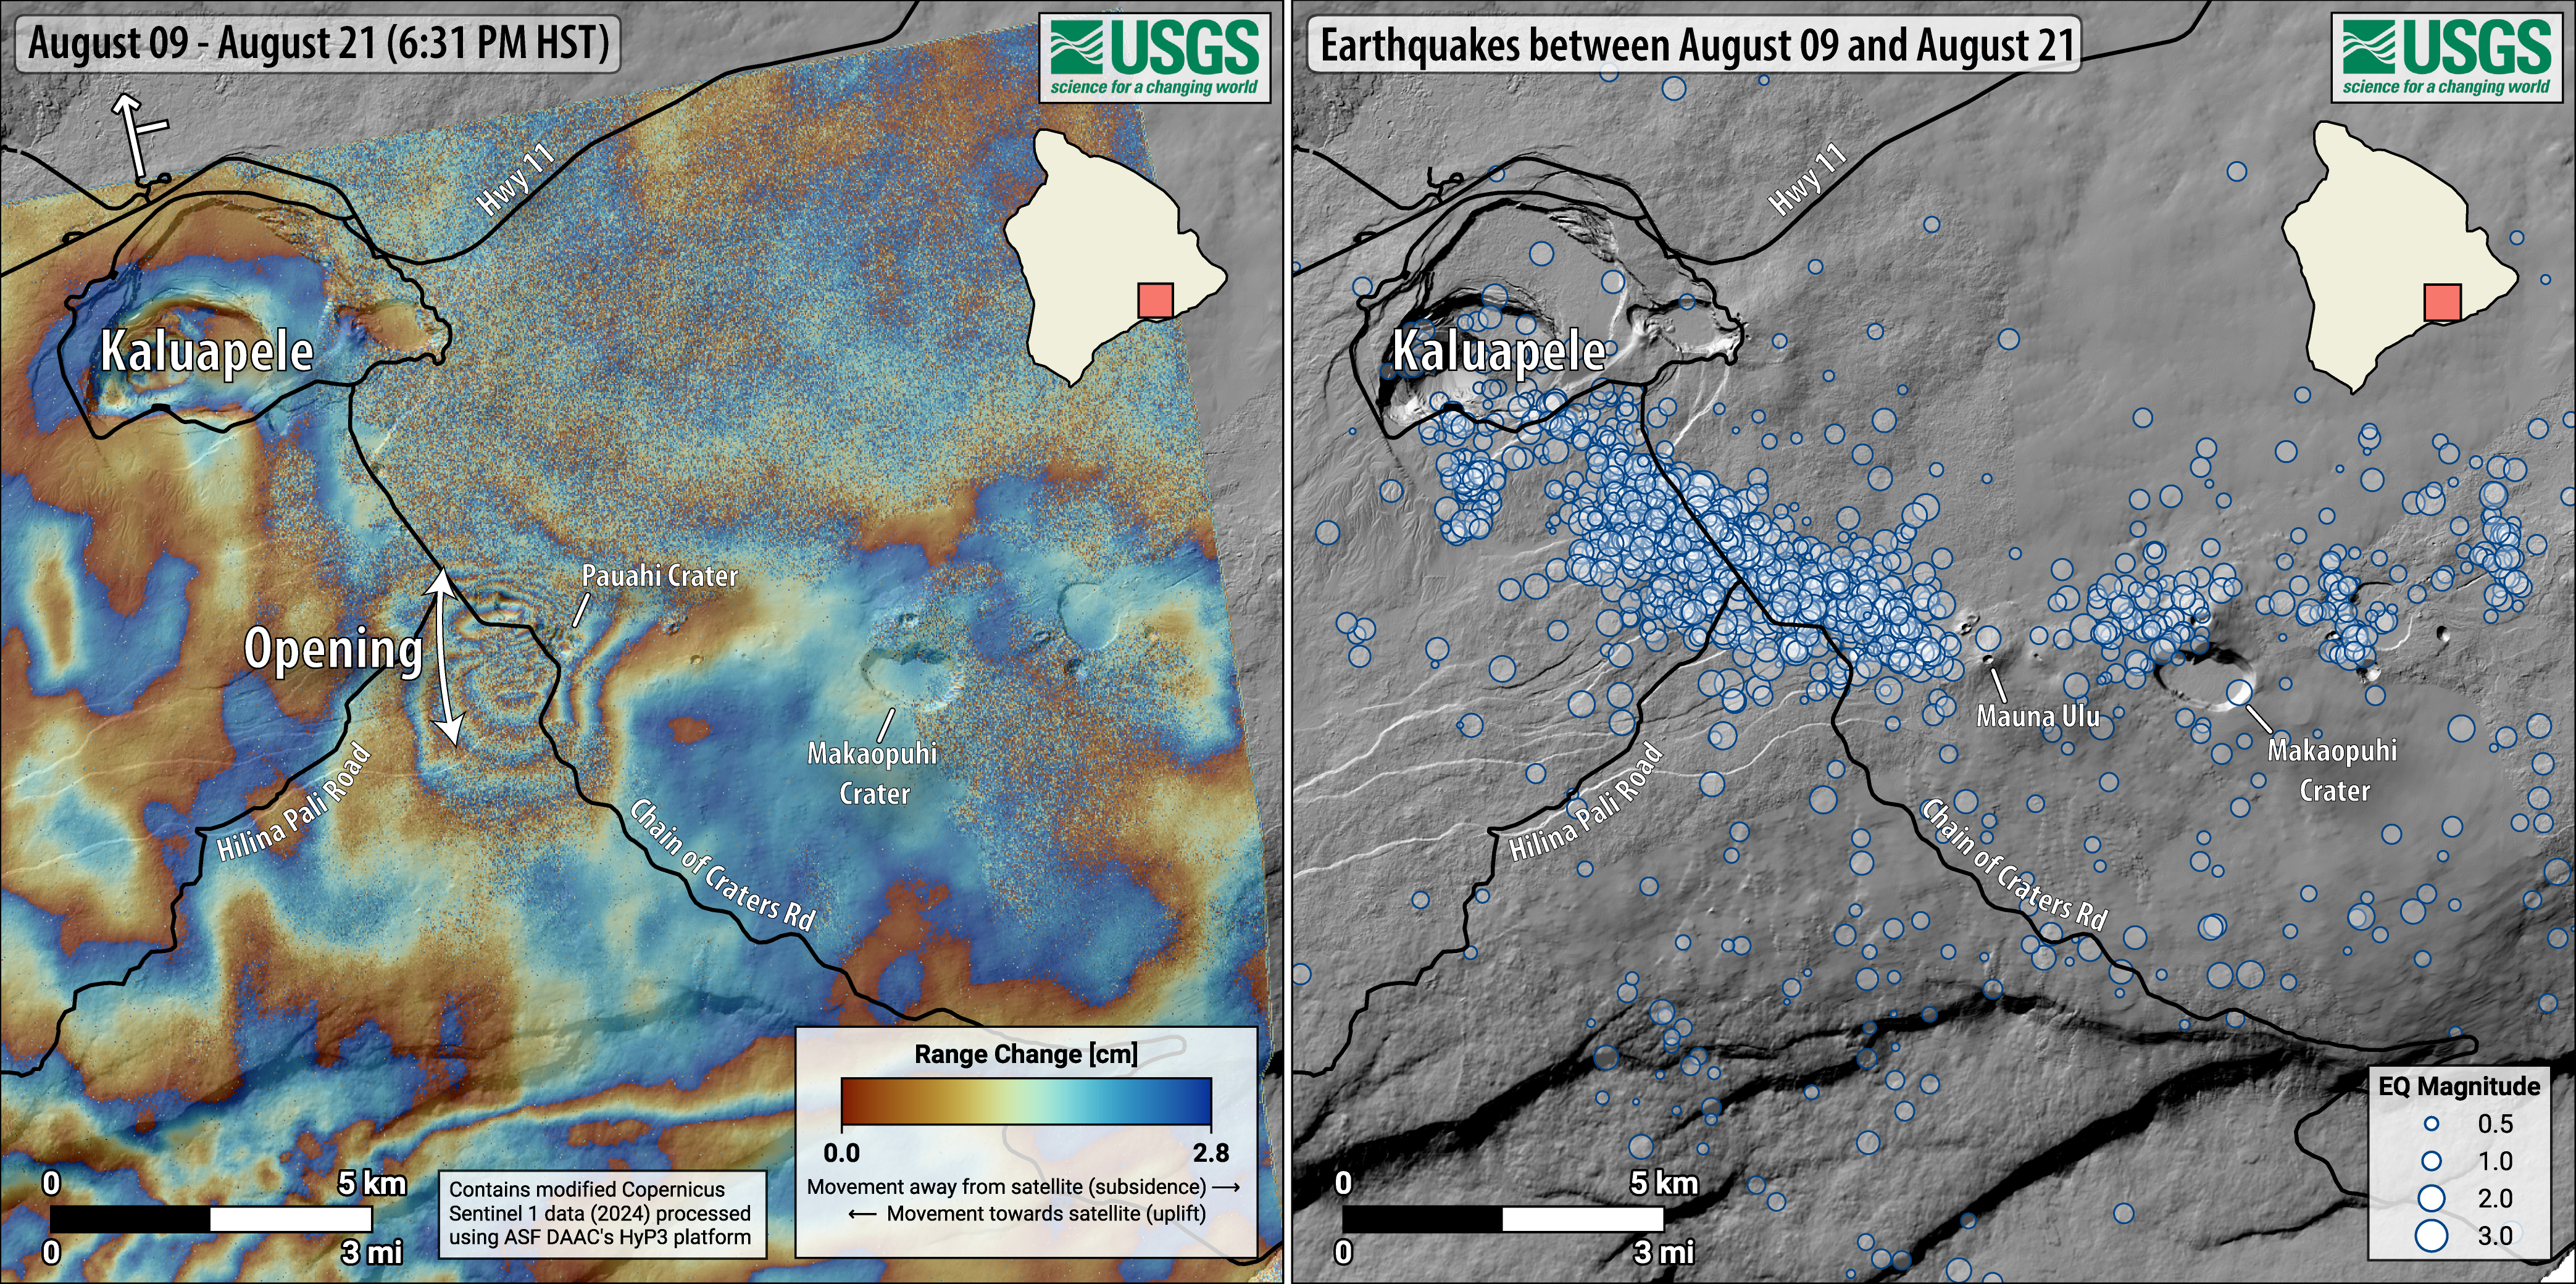
USGS/HVO; modified Copernicus Sentinel-1 data (2024), ASF DAAC HyP3 · Public Domain
An analysis published by the USGS Hawaiian Volcano Observatory on 23 October 2026 revisits Kīlauea’s sequence of intrusions and eruptions after 2018. It was prompted by the intrusion of 30 September–1 October 2026 during the summit lava-fountaining sequence. Its value lies in comparing signs of underground magma movement over time, without treating every intrusion as a promise of eruption.
The visual example pairs maps for 9–21 August 2024. On the left, Sentinel-1A data show ground deformation; each colour cycle represents 2.8 cm of change in radar-measured distance. Earthquakes from the same interval appear on the right. During the night of 19–20 August, more than 200 events accompanied the upper East Rift Zone intrusion; most were below magnitude 2.0 and the largest reached 3.7, at depths of 1–3 km.
InSAR compares radar images acquired on different dates. Fringes include displacement along the satellite’s viewing direction, but can also reflect atmospheric, orbital and topographic effects that must be considered. Because radar looks obliquely, the signal combines horizontal and vertical components. Therefore, 2.8 cm per cycle should not automatically be described as 2.8 cm of vertical uplift.
The retrospective documents different outcomes. Intrusions southwest of the summit were recorded in October and December 2023 and between January and February 2024. In June 2024 another intrusion was followed the next day by an eruption lasting about nine hours. That September, an intrusion near Makaopuhi preceded the 15–20 September eruption at Nāpau. This diversity reinforces the value of following the signals’ spatial and temporal evolution together.
Today’s situation must be read separately from the historical image. In its 24 October 2026 bulletin at 18:37 GMT, HVO maintained the pause after episode 55 and the ADVISORY/YELLOW status. The forecast window for episode 56 was 30 October–5 November, conditional on the reinflation pattern continuing. The observatory stressed uncertainty about that regularity; the forecast does not confirm the start of new lava fountains.