
Night lights reveal Isaias impacts along Florida’s coast
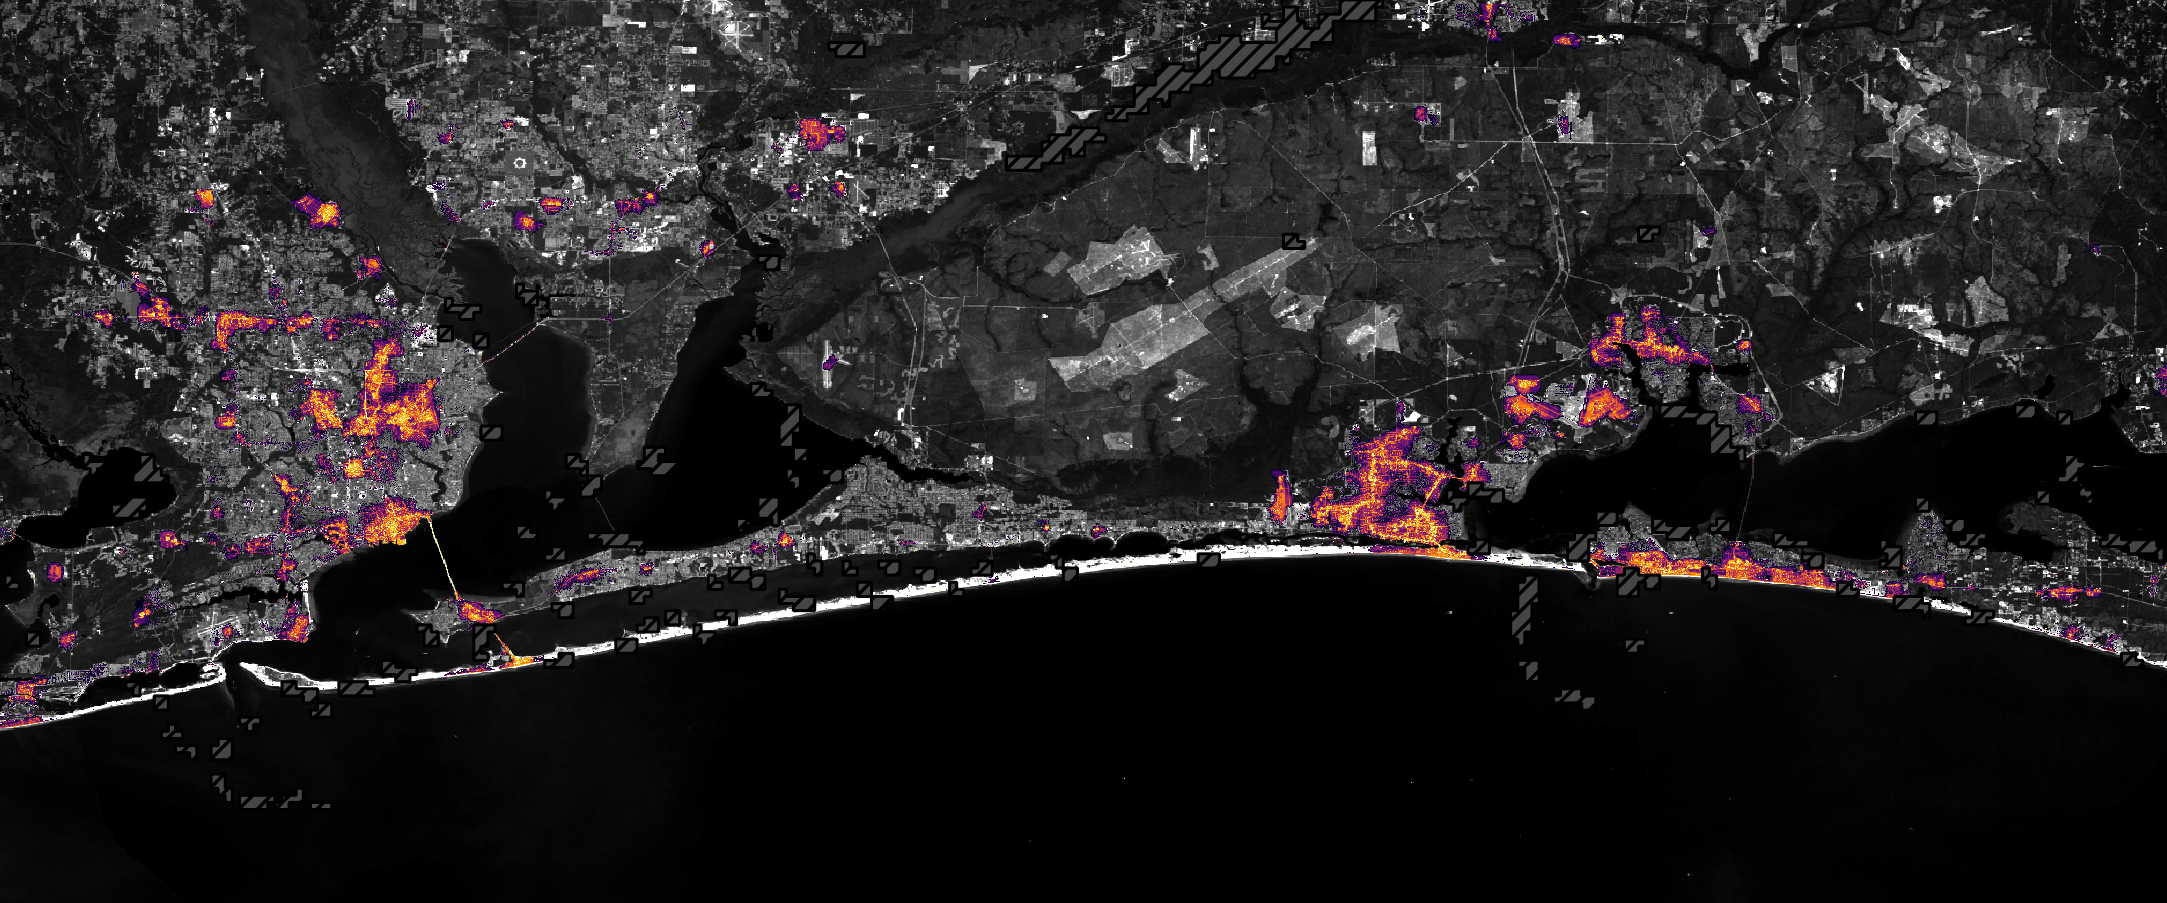
Black Marble HD images released October 16 show lighting changes after the hurricane. They are modelled visualisations, not counts of homes without electricity.
RockGeo Editorial · Published on
Event date: 10/11/2026 · Source date: 10/16/2026
Sources accessed on 10/16/2026, 15:40 GMT
NASA Earth Observatory / Lauren Dauphin; Black Marble HD: Ranjay Shrestha / NASA GSFC; Landsat: USGS · NASA editorial media usage guidelines
A report by Kathryn Hansen, published by NASA Earth Observatory on October 16, 2026, presents nighttime-light images after Hurricane Isaias along Florida’s coast in the United States. Comparing an August composite with the October 11 observation shows reduced lighting in Pensacola and along the U.S. Route 98 corridor toward Destin. The pattern suggests electricity supply disruptions.
The material combines nighttime VIIRS data from NOAA-20 with a Landsat 9 base map. Processing accounts for landscape, atmospheric and lunar-phase changes and removes stray light. Gray hatched areas mark locations where clouds prevented observation; missing information should therefore not be interpreted as lack of electricity.
The sequence includes October 12, when lights returned in some areas. According to the report, by October 14 patterns resembled those before the storm. Locations that remained illuminated could reflect backup systems or infrastructure differences, but an image alone cannot identify the cause. Nor does it confirm conditions at each property.
Black Marble HD documentation adds an essential limitation: its 30-metre scale comes from modelling light distribution using the Black Marble nighttime product. It is not an independent measurement of the electricity network in every cell. NASA recommends these images for visualisation, not quantitative analysis.
For disaster mapping, comparing affected areas and their evolution can support visual assessment of recovery. Products are available to public and commercial users but may be experimental or research grade. The portal warns that continuous availability and routine updates are not guaranteed; operational use requires assessing whether the data are suitable.