
NASA compares the 2026 El Niño with 1997 through Pacific sea level
Altimetry maps show a pattern resembling 1997. NOAA’s intensity forecast remains probabilistic and does not guarantee local impacts.
RockGeo Editorial · Published on
Event date: 10/12/2026 · Source date: 10/23/2026
Sources accessed on 10/23/2026, 15:42 GMT
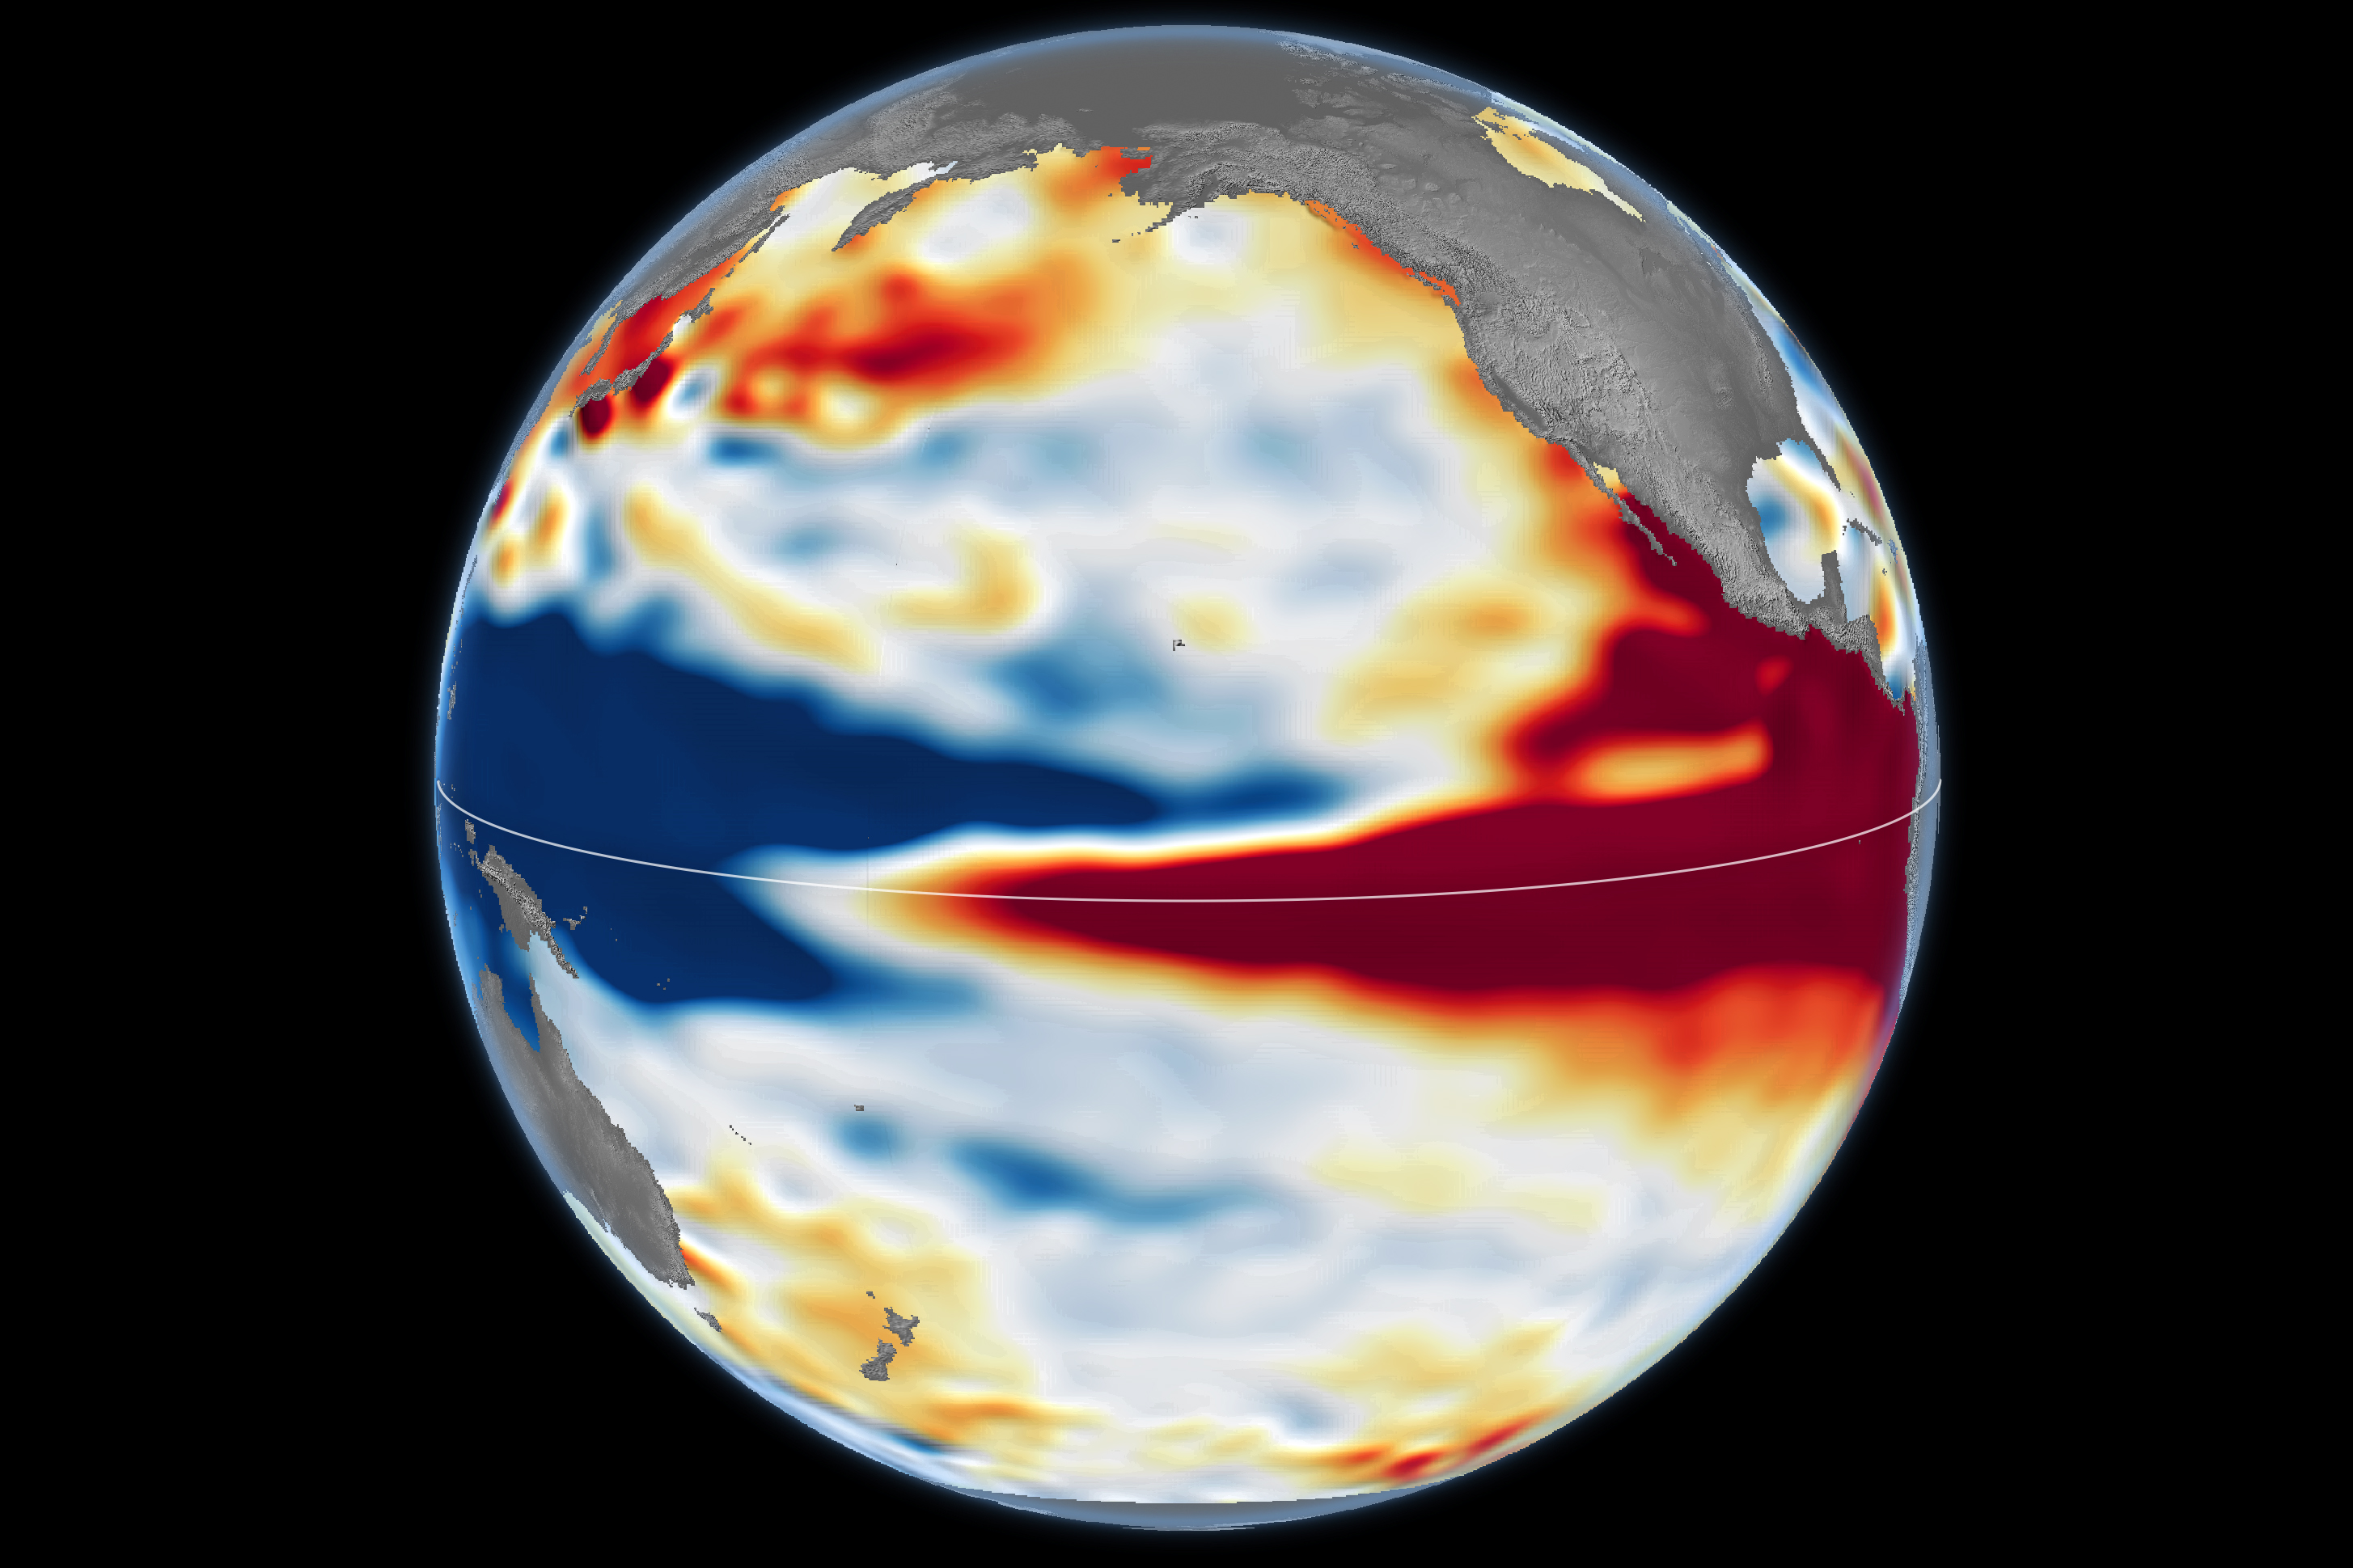
NASA Earth Observatory / Lauren Dauphin; NASA/JPL-Caltech · NASA media guidelines — factual editorial use
On 23 October 2026, NASA published a comparison of the current El Niño with 1997. Kathryn Hansen’s Earth Observatory report brings together sea surface height maps for 13 October 1997 and 12 October 2026. The data come from TOPEX/Poseidon and Sentinel-6 Michael Freilich, respectively, and were processed at JPL.
Red indicates height above average; white, near-average conditions; blue, below average. Expanding warm water helps connect this signal with heat accumulation. Seasonal cycles and long-term trends were removed. The spatial resemblance to 1997 is an observation rather than a guarantee that the effects of that event will repeat.
El Niño involves coupling between ocean and atmosphere. Weaker trade winds allow warm water to move eastward and reduce the upwelling of cold, nutrient-rich water. Redistributed heat changes atmospheric circulation. Observations of the ocean, winds, clouds and rainfall therefore need to be analysed together to understand how the phenomenon evolves.
In its 8 October diagnostic discussion, NOAA reported a strengthening El Niño and a greater than 83% probability of a strong-to-very strong event through January–March 2027. The Niño-3.4 index had reached +2.1 °C, while parts of the eastern equatorial Pacific exceeded +4.0 °C. These are temperature anomalies, distinct from the sea surface height shown in the image.
The official forecast synthesises several models and observations of the ocean–atmosphere system. Even for an intense event, NOAA stresses that El Niño-related impacts become more likely but are not guaranteed. These percentages describe the phenomenon’s strength, not the probability of flooding or drought in any city. The monthly diagnosis consulted is dated 8 October; NASA’s report is dated 23 October.